 |
Prediction of Spatial Patterns of Urban Dynamics in Pune, India
Bharath. H. Aithal1,2, Vinay S1, Venugopal Rao K.3, T.V. Ramachandra*1,2,4 |
 |
1Energy & Wetlands Research Group, Center for Ecological Sciences [CES],
2Centre for Sustainable Technologies (astra)
Bangalore, Karnataka, 560 012, India*Corresponding Author E Mail: cestvr@ces.iisc.ac.in.
*Corresponding Author: T.V. Ramachandra, cestvr@ces.iisc.ac.in
3National Remote Sensing Centre, Department of Space, Government of India, Hyderabad, http://nrsc.gov.in.
Study area and Data
Pune, earlier known as Poona is the cultural capital of Maharashtra and is also known as “Queen of Deccan”. Pune is located in the western part of Maharashtra state between 18°32´ N and 72° 51´E at a height of 560 m above mean sea level. It lies near the confluence of the Mula-Mutha River. The Pune Municipal Corporation covers an area of 243.84 sq. kms. Population during 1901 to 2011 showing an increase by 347%. Pune being one among incipient mega cities in India has seen the large scale development in recent times. Population of Pune has increased to 9 million (Census 2011) from 7 million in 2001 (Census 2001). Figure 1 shows the study region
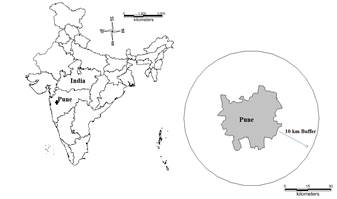
Figure 1: Study area considered, Pune and 10km buffer.
Pune Municipal Corporation with forty-eight wards is the civic body that is responsible administration and infrastructure development of the city and it is known as the Pune Mahanagar Palika (PMP). The current study has been carried out in a region of 1524.4 sq. km consisting of municipal corporation administrative region with 10 km buffer. Buffer of 10 km is considered to account the growth in the peri-urban regions
Time series spatial data acquired through Landsat Series thematic mapper (30m) and Landsat 8 operational image scanner (30m) sensors for the period 1992 to 2013 were downloaded from a public domain Global Land Cover Facility [27]. Survey of India (SOI) topographic sheets of 1:50000 and 1:250000 scales were used to generate base layers of city boundary, training sites, generation of polygons for attribute data, drivers of change etc.
Method
Spatial pattern of urbanisation is assessed using temporal remote sensing data of 1992 to 2013. Data analyses include:
Pre-processing: Remote sensing data (Landsat series) for Pune, acquired for different time periods, were geo-corrected and cropped pertaining to the study area. Geo-registration of remote sensing data (Landsat data) has been done using ground control points collected from the field using pre calibrated GPS (Global Positioning System) and also from known points (such as road intersections, etc.) collected from geo-referenced topographic maps of the Survey of India.
Land use analysis: This involves i) generation of False Color Composite (FCC) of remote sensing data (bands – green, red and NIR). This helped in locating heterogeneous patches in the landscape ii) selection of training polygons (these correspond to heterogeneous patches in FCC) iii) loading these training polygons co-ordinates into pre-calibrated GPS, iv) collection of the corresponding attribute data (land use types) for these polygons from the field. GPS helped in locating respective training polygons in the field, v) supplementing this information with Google Earth, vi) 60% of the training data has been used for classification, while the balance is used for validation or accuracy assessment.
Land use analysis was carried out using supervised pattern classifier -Gaussian Maximum Likelihood Classifier (GMLC) algorithm using various classification decisions based on probability and cost functions [28, 29, 30]. Remote sensing data was classified using training data of all land use types as detailed in table 1. Mean and covariance matrix are computed using estimate of maximum likelihood estimator. Land use was computed using the temporal data through the open source program GRASS - Geographic Resource Analysis Support System.
Statistical assessment of classifier performance based on the performance of spectral classification considering reference pixels is done which include computation of kappa (κ) statistics and overall (producer's and user's) accuracies [31, 32].
Modelling urban dynamics using fuzzy-AHP-MC-CA: Standardization of agents and process using fuzzy charecteristics and Weighted principal agents using AHP
In order to determine the influence of the factors affect land use transition probabilities agents were selected based on preliminary studies e.g., [25, 33], were employed within an AHP framework. The relative influence of each factors are determined by fuzziness using sigmoidal increasing and decreasing functions based on each factor combinations.
For example, the areas with slopes less than 20% are probable candidates for urban growth. This is modeled as a sigmoidal decreasing function in which suitability starts at zero and levels off at 20%. It may be noted that choosing the type of fuzzy membership function and corresponding control points is prone to subjectivity. Further, importance of each factors was determined by AHP. Further, logical consistency of determined weights was verified using consistency ratio. The value of 0.03, which is below the critical value of 0.1. The individual weights for urban is as determined are listed in Table 1. Factors with higher weights are considered to be statistically more effective.
Factor |
Weightage |
Industry |
0.385 |
Road |
0.2665 |
Bus stops and Railway stations |
0.1566 |
Education |
0.0806 |
Socio-economic |
0.0486 |
Religious |
0.0398 |
Crematorium |
0.023 |
Table 1: example of weightage generated for each factor
Once weights are determined MCE was used to determine the site suitability considering two scenarios i). Restrictions based on City Development Plan (CDP); ii)). as usual scenario without CDP. These suitability change maps were considered in the MC-CA model.
Modelling using MC-CA model
Considering land use of 1992-2000 and 2000 - 2010, transition potentials were computed using a Markovian process (table 2). For calibration purposes, CA first input the transition probabilities for the years 2000-2010 and the suitability map to project the previously known built-up areas for 2013. Using and hexagonal CA Filter of 5 x 5 neighborhood with variable iteration at every step until a threshold is reached. Careful model validation through kappa statistics was conducted to assure accuracy in prediction and simulation. Built-up areas were predicted for 2013 were cross-compared with the actual amount of built-up areas in 2013 using classified data. The kappa index of 81.5% and accuracy of 82.2% shows a good agreement accuracy of the model. Accordingly, the model was refitted with similar parameter settings Using the land use data from 2010 to 2013, the transition probabilities from 2010 to 2013, and the identical suitability map. The future patterns of urban expansion were then simulated for the years 2016, 2019, 2022, 2025.
Probability of changing to |
|||||
Given Land use |
Land Use |
Urban |
Water |
Vegetation |
Others |
Urban |
0.8453 |
0.1547 |
0 |
0 |
|
Water |
0.0338 |
0.8363 |
0.0793 |
0.0506 |
|
Vegetation |
0.0327 |
0.0056 |
0.3517 |
0.61 |
|
Others |
0.1446 |
0.0029 |
0.2008 |
0.6517 |
|
Table 2: Markov transition potential
| * Corresponding Author : | |||
| Dr. T.V. Ramachandra Energy & Wetlands Research Group, Centre for Ecological Sciences, Indian Institute of Science, Bangalore – 560 012, INDIA. |
Tel : 91-80-23600985 / 22932506 / 22933099, Fax : 91-80-23601428 / 23600085 / 23600683 [CES-TVR] E-mail : cestvr@ces.iisc.ac.in, energy@ces.iisc.ac.in, Web : http://wgbis.ces.iisc.ac.in/energy |
||